
All News
July 07, 2026
Gold fell 1.41% to $4,117.03, silver dropped 3.03% to $60.70, platinum rose 0.38% to $1,653.50, and palladium slipped 0.42% to $1,287.00 amid Iran tensions.
July 06, 2026
Gold rose 1.03% to $4,176.04, silver 2.16% to $62.78, platinum 0.55% to $1,645.70, and palladium 0.75% to $1,293.00 as markets reopened after July 4th.
July 02, 2026
Gold jumped 2.28% to $4,134.24, silver 3.47% to $61.68, platinum 2.56% to $1,633.40, and palladium 4.01% to $1,285.45 as a weak June jobs report hit the dollar.

July 01, 2026
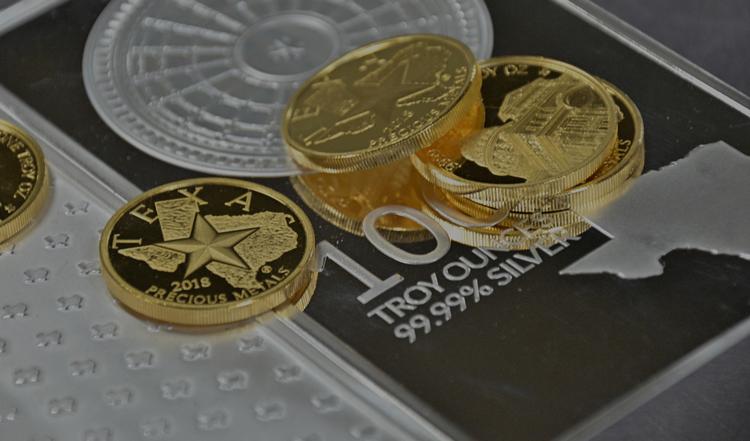
Texas Precious Metals has officially set the Guinness World Record for the world's heaviest silver coin with a 2,500 oz America 250 commemorative piece.
July 01, 2026
Gold rose to $4,042.15 (+0.57%), silver to $59.83 (+1.40%), platinum to $1,592.10 (+1.68%), and palladium to $1,237.08 (+0.44%) amid Fed rate uncertainty.
Latest Gold News

Doing Business The Texas Way


