Market News

June 10, 2020
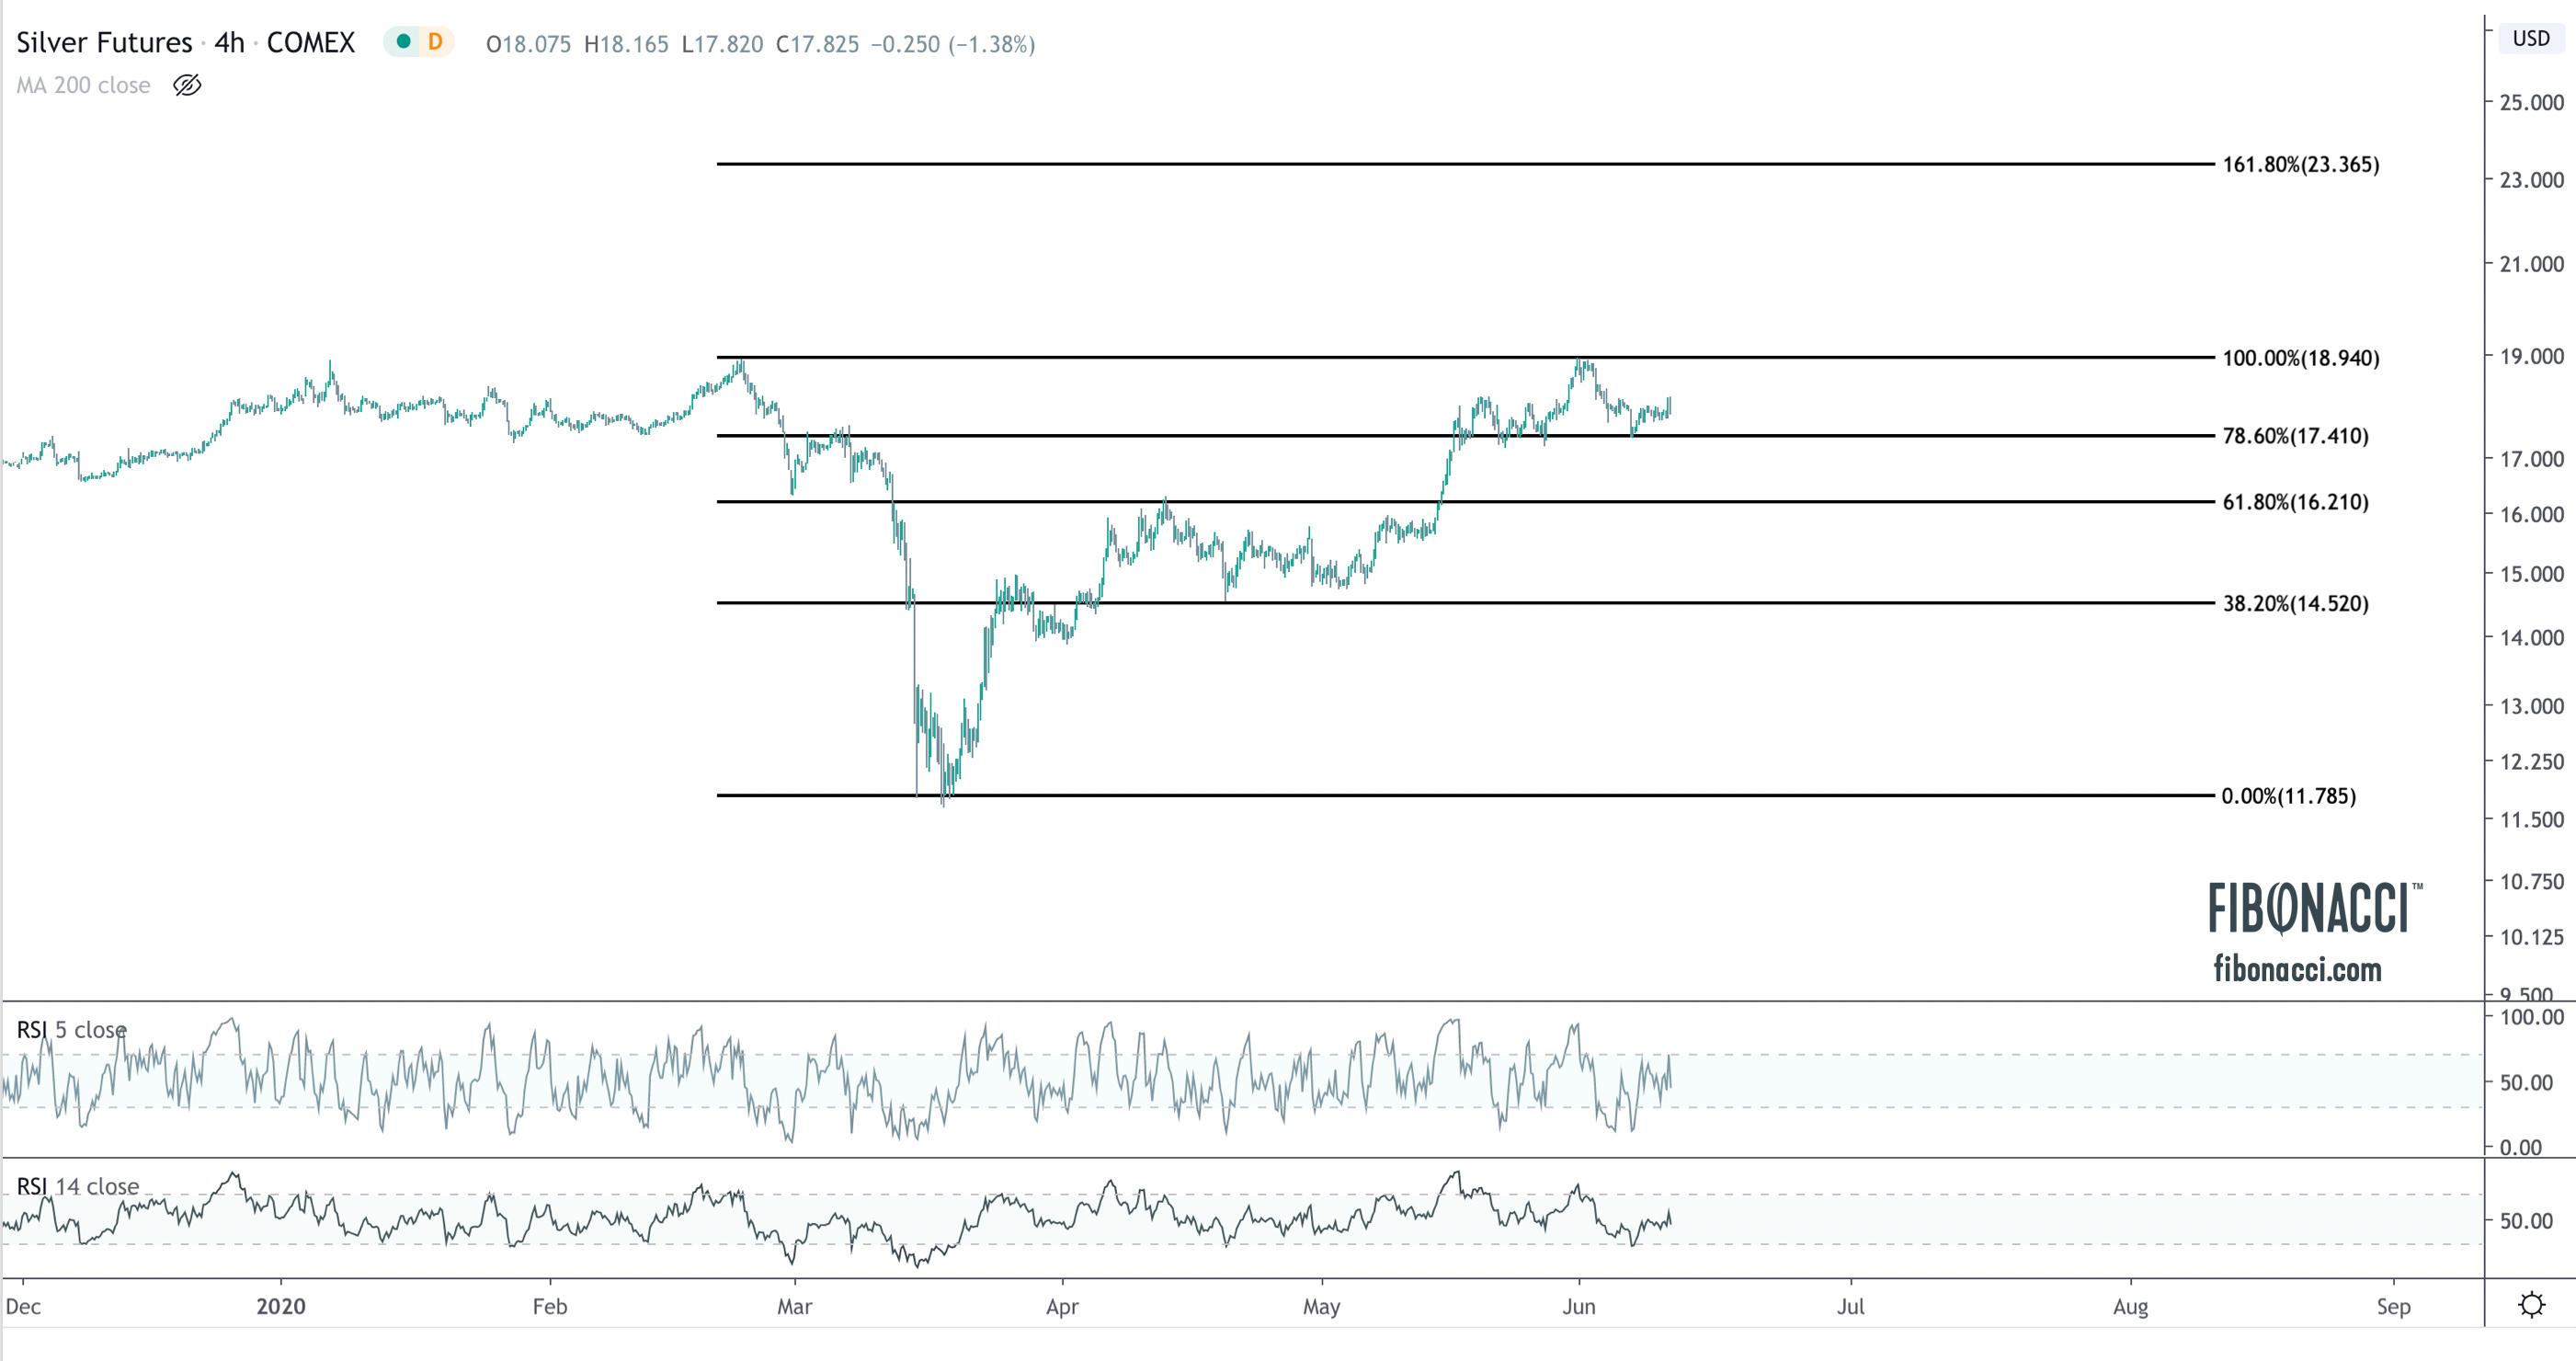
Silver has been a shining star in the metals complex since the March low of $11.60, outperforming all other metals on its run to $18.90/oz. The upside leadership was a welcome sign for precious metals bulls, as silver tends to be a bellwether for bullish appetite in the space.
I anticipated the bullish price action in silver on the breakout from $14.50. The most recent run to $18.90 encountered sellers for the second time since March, and since that time price has been consolidating in a falling wedge. The breakout of this wedge this morning on the 4hr chart looks promising for another run to $18.90, but price needs to definitively clear $18.18, which has been a strong area of selling action for the last few months.
Big picture, price is uptrending in a channel, and until the channel breaks, the trend remains up. Recently, price retested rising support from the March low and bounced nicely. Bulls want to see this hold. Bears need to push price down through 17.65, which, if successful, could usher in a drop to back to the 16.20 area.
I have my Fibonacci levels marked as follows, with a break of $18.90 setting up a run to $23+.
Big picture, the silver weekly chart is a confirmed breakout and successful retest of the falling trend line dating back to 2012. The breakdown in March appears to be a failed breakdown, and from “failed moves come fast moves.” price has also recaptured the 200 week moving average and seems poised for a run higher as we head into a stronger seasonal period in the fall.
May 07, 2020
It has been over a month since my last entry on the markets, and aside from a few Twitter posts, most of my analysis has been confined to my desktop. The impact of the coronavirus on the retail precious metals market has been historic, with dueling supply and demand shocks, and as president of Texas Precious Metals, my time has been consumed by day-to-day operations. I finally have a bit of a respite this afternoon to share a few thoughts on the metals markets.
GOLD
Back in November, I identified a 5-wave pattern setting up with two bull wedges that created a series of highly favorable long setups (see chart above). The big sell-off with the COVID debacle was concerning, but as we can see from the chart, horizontal support held and the bounce higher was strong and swift. It is possible (as some suggest) that Wave 5 is now completed, but I continue to think gold is pushing for all-time-highs based on price action and consolidation. Also encouraging is the fact that gold is sitting right at the anchored VWAP (volume weighted average price) from the March 31st lows. (I used TrendSpider for this chart.)
Zooming out to the monthly chart, the big selloff in March produced a long-legged doji that retraced the move to the 50% Fib retracement level (1450). Since that time, gold has rallied higher and seems to be pushing for a test of all time highs of $1910 (monthly close of $1830).
SILVER
Silver is also coiling for a move, sitting at both horizontal support and rising channel support. From a risk/reward standpoint, a long entry here with a stop below 14.60 is favorable. The upside should target ~18.80.
S&P500
Lastly, just a quick comment on the S&P 500. The bearish case is that we have witnessed the beginning of 5 waves down, with wave 1 culminating in March and an A-B-C correction into April and early May. There is a head and shoulders top just below the 61.8% fibonacci retracement and a break of rising channel support would target 2620. The bulls would gain the upper hand if channel support holds and we break above 2940-2950 to the upside. A big rally to 3300 would likely ensue.

April 02, 2020
When people are worried about the future they turn to gold to protect their savings. That’s rarely been more true than today.
Surging demand and disruptions from the coronavirus pandemic have created a shortage of the small gold bars most popular with consumers. Those who do manage to get their hands on metal have to pay up –- well above the per-ounce prices being quoted on financial markets in London and New York.
Some dealers are desperately contacting clients to see if anyone is willing to sell their gold bars and coins, and offering a rare premium over spot prices. Others have given up trying to trade altogether.
“People want to buy, not to sell gold,” said Mark O’Byrne, the founder of GoldCore, a dealer based in Dublin. “We have a buyers’ waiting list and we emailed our clients seeing who wished to sell their gold. At this time there is roughly only one or two sellers for every 99 buyers.”
Size is a key reason for the crunch. While there’s plenty of gold in a big trading hub like London, banks and other institutional investors there typically use large bars of 400 ounces. That’s not practical for a regular person who may not want to cough up more than $600,000 for a single bar. Instead, retail investors prefer kilobars (about 32 ounces), 1-ounce bars and coins, or something even smaller.

March 12, 2020
The sell off in markets accelerated by coronavirus and the global reaction to curtail the pandemic has left no prisoners, as nearly all asset classes are selling off in a flight to liquidity. As large institutions face margin calls, they are forced to close positions or raise cash by selling anything and everything that is liquid. Gold and silver - the “safe haven” assets - are no exception. I would remind readers that in the global financial crisis gold fell 27% and silver fell 55% in nominal terms. Gold outperformed equities on a relative basis, but silver actually underperformed.
The selloff in the markets has gold now testing key technical levels and silver breaking down from support. Mining stocks have accelerated to the downside even faster. In a liquidity crisis, nothing is immune.
GOLD
Gold is now retesting the rising trend line from the August 2018 low. A break here would target the major horizontal breakout area ~$1530-$1540. That will be the last gasp to preserve a bullish regime. If price trades below that level, it could send gold down towards a retest of the six-year breakout level at 1370.
GDX - GOLD MINERS ETF
GDX is in a similar position to gold. All key technical levels have broken down and only one remains before a complete capitulation (the rising trend line from July 2018) at ~21. A breakdown there would target 17.
SILVER
Silver has broken down from its megaphone pattern, and most importantly just broke horizontal support. This is bearish action in silver, and there is no meaningful support here until a retest of 14.30 from May 2019.
Trading activity in the physical market has been extremely robust and consuming nearly all of my time, but I will try to keep updates coming. Be safe out there!

March 03, 2020
FEAR OR GREED?
The last two weeks have been extremely volatile in the markets, and for the first time in a long time my friends and family have called to inquire about “what is going on in the markets?” Coronavirus contagion fears, coinciding with all-time highs in the markets, has been the scapegoat for a rapid, deflationary decline across nearly all markets except bonds, which resiliently continued to fetch a bid. Even the US Dollar, traditionally a safe haven in deflationary swoons, declined.
Here is how I see the markets:
S&P500
The S&P500 broke out to all time highs in September of 2019 and proceeded on a rapid, almost linear ascent to new highs ~3400. During this period, equities became way overbought, and the fear/greed index topped out at an unimaginable 97/100. These levels are/were unsustainable. That this inevitable pullback has been violent and rapid is as much a reflection of the swift ascent of the market as it is any underlying issue or influence of a pandemic. As the saying goes, the market is a staircase up and elevator down.
In the initial decline, I expected the S&P to find support ~ 3030-3060 level, where there was a confluence of rising channel support, horizontal support, and the 200 DMA. This area was also an approximate 10% decline from all-time highs.
However, equities knifed through these levels on the way to rising channel support from the 2018 low, and in the process reversed the enthusiasm from January, got way oversold, and pushed the fear/greed index to 5/100. This is where we have seen the bounce.
And if we zoom out even further, and use a close-only linear chart to remove the noise and volatility of the candles, the pattern is a really simple (and bullish) breakout and successful retest. Resistance is now support.
BONDS
The response to these panicked conditions has been further monetary easing, as the plunge protection team came to the rescue this morning with a significant 50 basis point rate cut, adding further fuel to the bullish case for bonds and reinforcing the thesis that the Fed’s true mandate is supporting the equity market. Using the ETF TLT (20-year treasury bond ETF) as a proxy for the bond market, the chart remains bullish in a rising channel with an initial target of 158 (an area I have targeted for nearly a year).
Of particular interest to me is the mortgage-backed securities ETF the MBB, which is the best proxy for the trend of mortgage rates. The January breakout was a signal that the MBB was poised to retest all-time highs at 110+. Based on the strength of this move, I think we get there and eventually break out to new all-time highs. This is going to create a tailwind in the housing market as mortgages get cheaper. Those who already own a home should benefit through the refinance process.
US DOLLAR
The monetary easing has put a headwind on the US Dollar, which in the recent rise to ~99 reacted to the long term falling trend line and is now falling back towards rising channel support from May 2018. I continue to believe a long term secular resolution for the dollar is coming before year end.
PRECIOUS METALS
The precious metals sector remains in a strong bullish uptrend. Like the S&P, gold broke out above former resistance to new six-year highs at $1690, and swiftly dropped $100/oz to retest the breakout level. That level is now support, and as of this writing gold has bounced hard back up to $1650.
Silver has bounced off of horizontal support and is forming a broadening megaphone pattern. A sustained move above $18.60 should set up a move to $20.70.
The miners also remain in a bullish uptrend. Support has held for GDX, which is consolidating in a rectangle pattern just below resistance at 31. The measured move on a breakout would target the 36-37 level, which coincides with the 50% Fibonacci retracement.
Horizontal support and rising channel support also held for the Junior miners, GDXJ, which seem poised for another run at resistance at 52.