Library
November 23, 2020
In my last post, I commented on the strong breakouts in metals out of bull wedge consolidations. These breakouts were ultimately short-lived and quickly reversed on vaccine news, washing out swing longs and once again pushing price lower to another test of falling resistance. The thesis from that post remains intact – metals continue to remain in strong uptrends with price likely to push to higher highs – but in the near term price continues to digest supply and needs more time.
GOLD
Gold has a confluence of support coming in at 1832, 1828, and 1822. Below there, 1790 lingers as the key breakout level from the 7-year base. With stochastics oversold, the downside on this selloff looks limited. For those with a longer time horizon, the area between 1790-1830 is a strong area of support.
SILVER
In Silver, I am watching 23.08 (retest of 161.8 Fibonacci extension) and 22.57 (the anchored VWAP from March low) as important levels. Like gold, silver is getting a little oversold on stochastics and I think the 22.57-23.08 is very likely to hold.
10-YR NOTES
Gold has been highly correlated to 10-year notes, which have also been consolidating and are now coming into rising support from the October 2018 low. Long consolidations like this within strong uptrends are much more likely to resolve in the direction of the underlying trend, and if 10-year notes rally off support, we can expect gold to be not far behind.

October 29, 2020
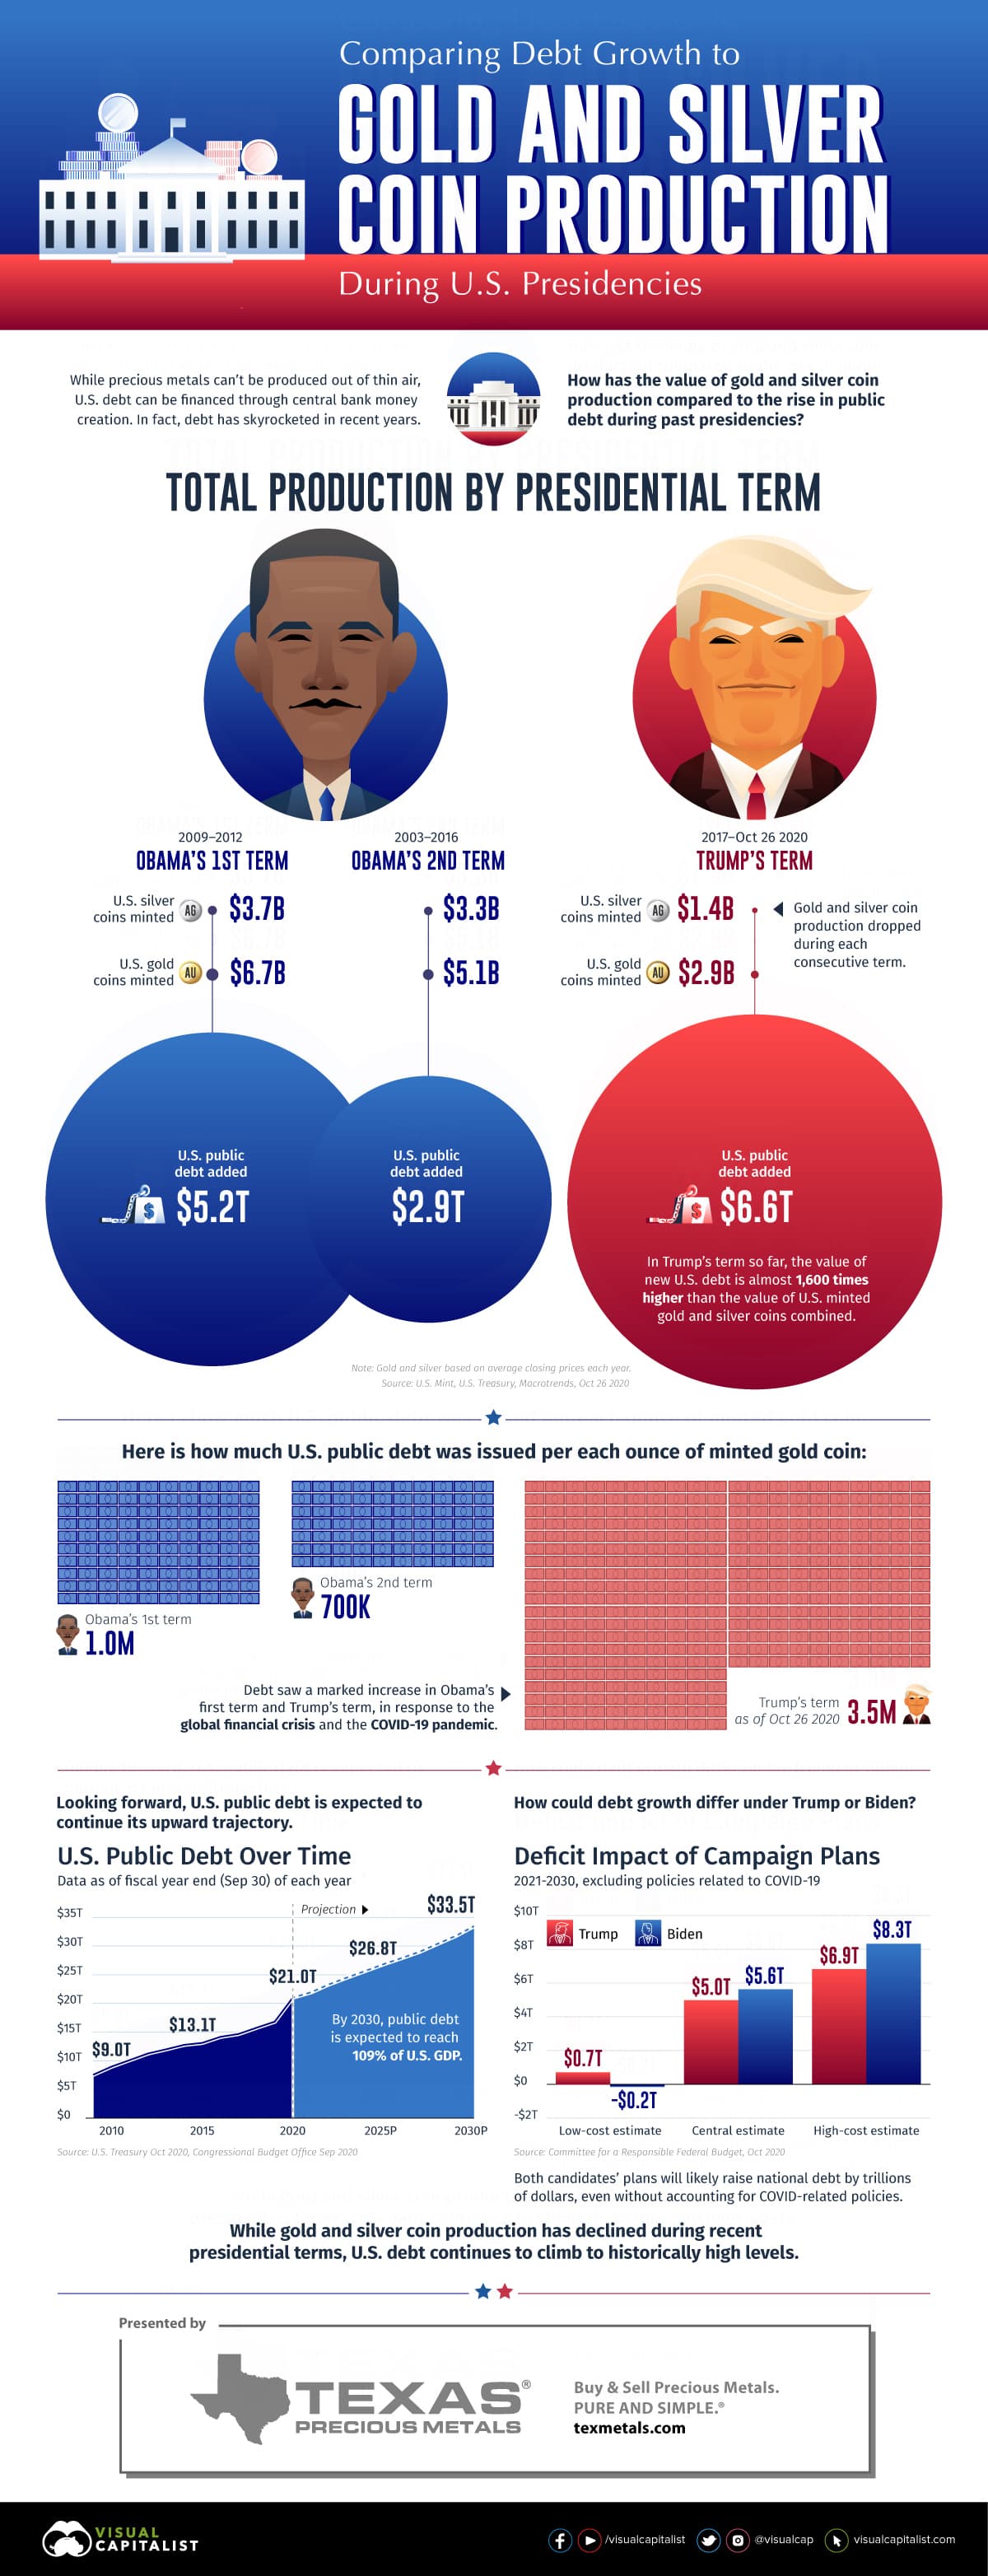
While precious metals can't be produced out of thin air, US debt can be financed through central bank money creation. In fact, debt has skyrocketed in recent years.
How has the value of gold and silver coin production compared to the rise in public debt during past presidencies?
Take a look at our infographic to see how US debt and US Minted Gold and Silver correlate.

October 15, 2020
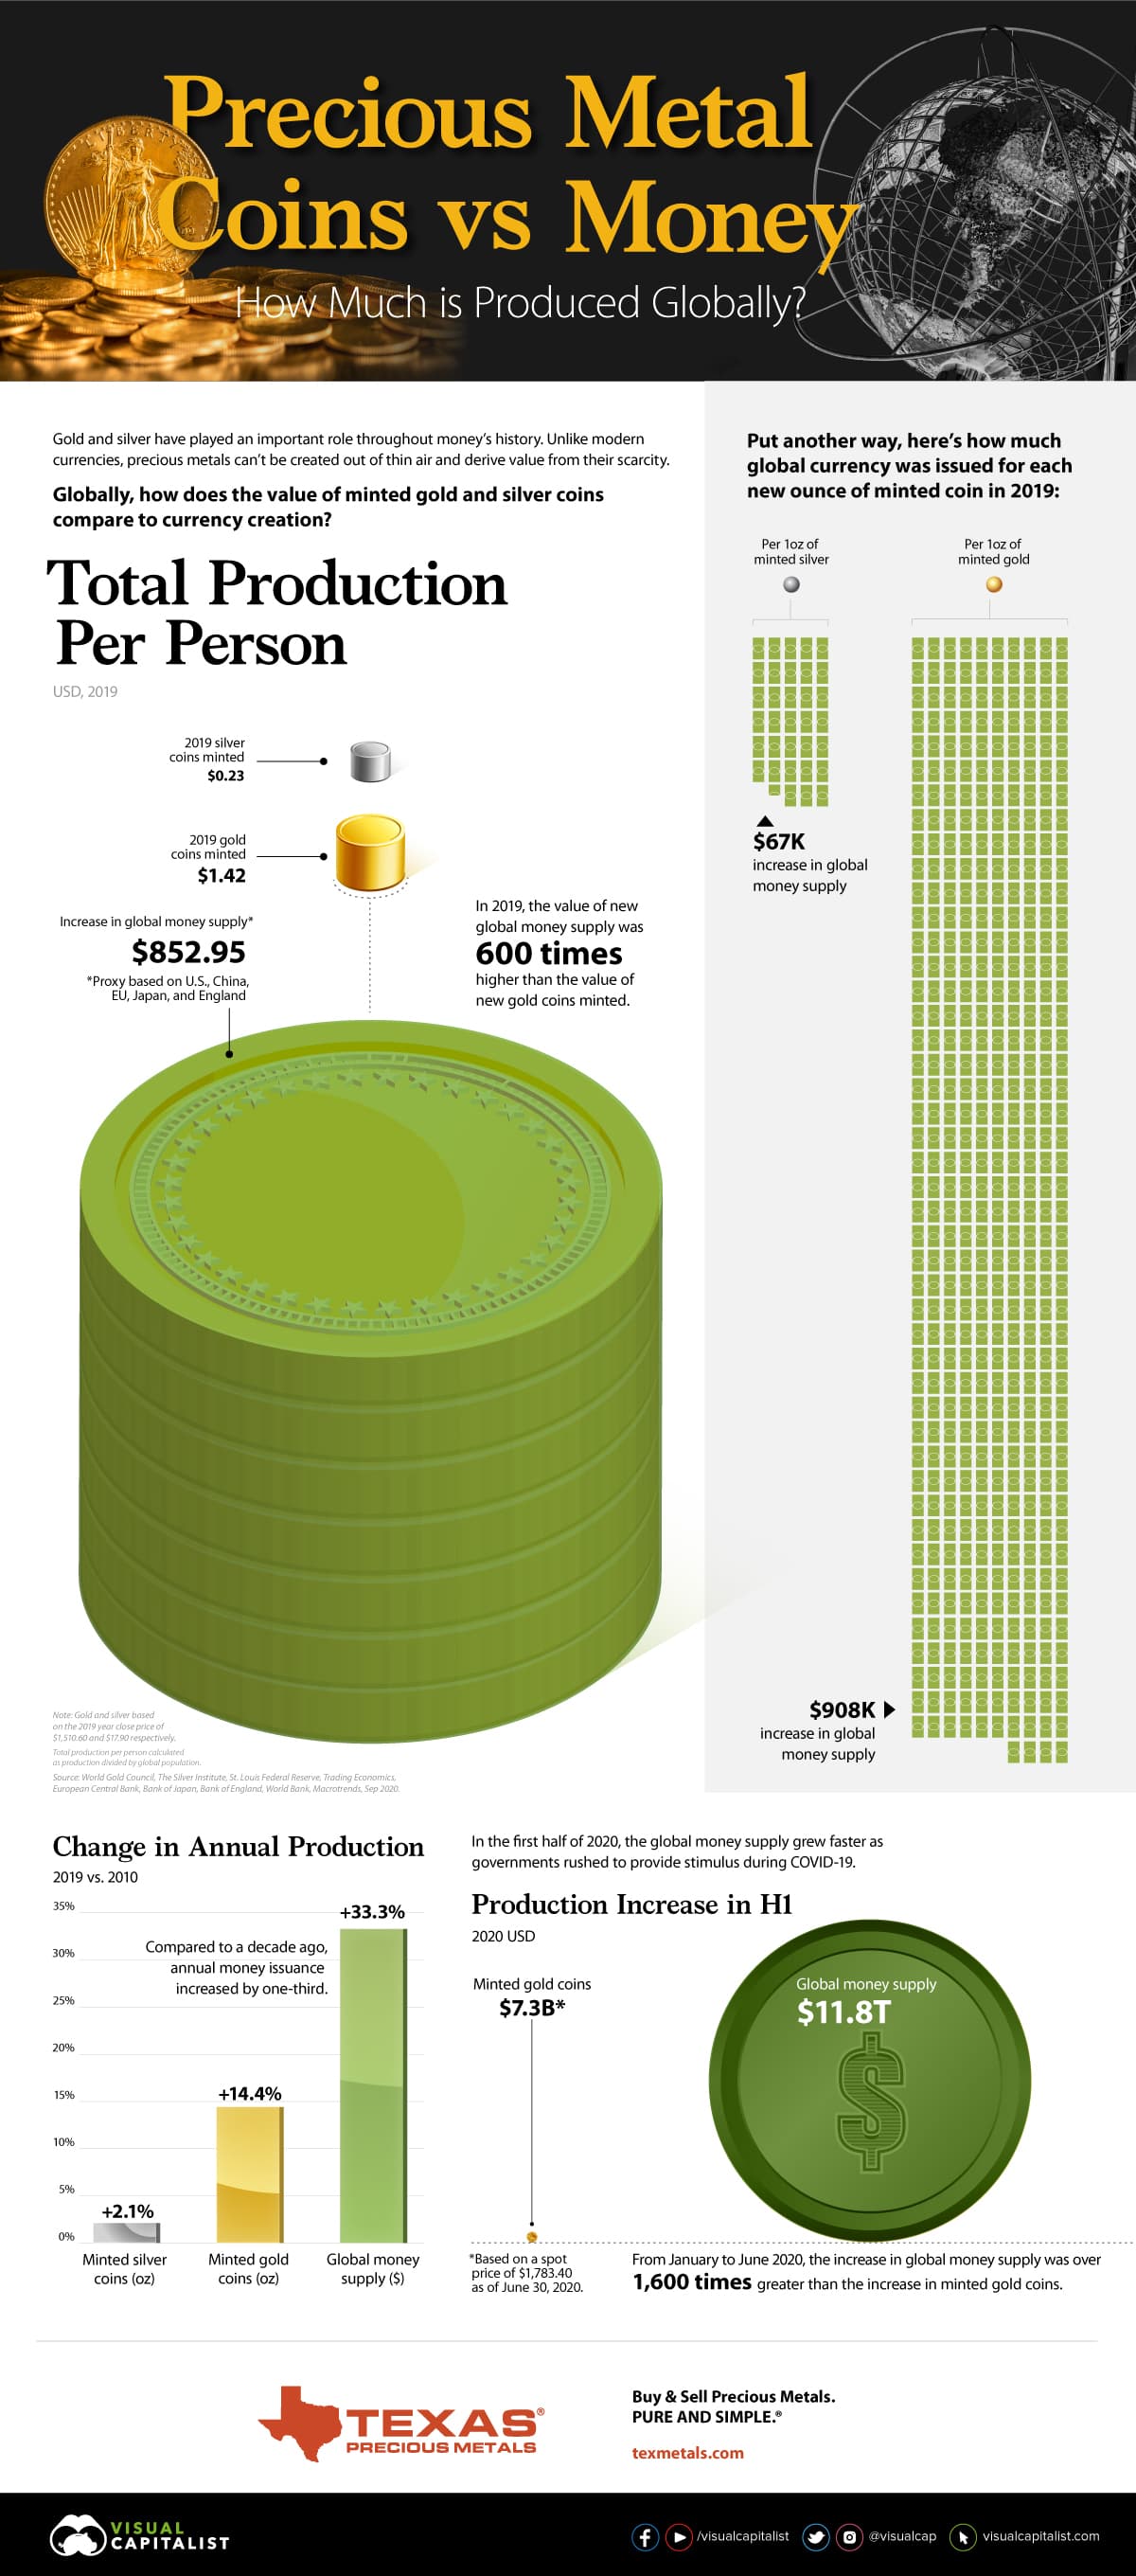
How Much is Produced Globally
Gold and silver have played an important role throughout money's history. Unlike modern currencies, precious metals can't be created out of thin air and derive value from their scarcity.
Globally, how does the value of minted gold and silver coins compare to currency creation?
October 14, 2020
On the topic of future inflationary or deflationary expectations, there are strong fundamental arguments on both sides. In my simple interpretation, the deflationary camp (dollar bulls) make the case that the economy remains fractured, entire industries are being undermined by the pandemic, there is high unemployment, the personal savings rate is up, the stock market is at stretched valuations, the housing market is approaching bubble territory, and the demand for US dollars remains the prevailing undercurrent of international trade. The Fed, despite its best efforts, cannot seem to meet its inflation target. Further economic weakness or perhaps a market crash would incite a flight to liquidity, demand for dollars to meet debt obligations, and broad debt defaults, further tightening the monetary supply. A strong dollar generally weighs heavily on the price of precious metals, particularly in short-term liquidity crises, and creates the potential for a near term headwind on metals prices.
The inflationary camp argues that the Fed – and policymakers – have shown their willingness to do “whatever it takes” to prop up the markets and inject unfathomable amounts of liquidity into the system. There is seemingly no limit to the tools available for this purpose, as we have seen direct stimulus injections into personal bank accounts, Federal programs such as PPP, and other fiscal interventions. In theory, a $1,200 stimulus check could be a $12,000 stimulus check or a $120,000 stimulus check. The government can continue to print, and can even choose to monetize the national debt.
As a technical analyst, these theories are beyond my capability to fully comprehend in whole or predict with any accuracy. I simply look at the charts to determine primary, secondary, and tertiary trends, and what those trends communicate about the environment now. My job is to react to what the market. On that point alone, this is what I see.
THE DOLLAR IS TRENDING DOWN
The primary, multi-decade trend in the dollar remains down. From 2008-2017 the dollar produced a powerful countertrend move that culminated in its third multi-decade lower high. This countertrend move broke down in March, has since pulled back to retest the breakdown, and appears poised for another leg down. The topping pattern formed from 2015-2020 appears to be a diamond reversal pattern. The primary downtrend would be violated only if price moved above falling resistance represented as the upper bound of the falling channel. So, in brief, the long term trend is down, the bullish, decade-long countertrend appears to be over, and it would appear that further weakness is ahead.
GOLD IS TRENDING UP
Conversely, gold is trending up. The countertrend bullish move in the dollar coincided with a countertrend bearish move in gold, which created a 7-year base (continuation pattern) that broke out to all-time highs this year. Gold remains in a 20 year uptrend, and the breakout to new all-time highs suggests that the primary trend is resuming its upward thrust.
THE STOCK MARKET IS TRENDING UP
The S&P500 also remains up. While a crash may be in the offing at some point in the future, the 12-year trend remains up, and even the historic Covid selloff in March was notably just a back test of the two-year price shelf from 2015-2017.
THE S&P500 PRICED IN GOLD IS TRENDING DOWN
Gold outperformance relative to equities remains noteworthy. The primary, 20+ year trend remains down. During the period from 2011-2018 when gold was basing, the S&P500 outperformed gold, but this entire moved appears to be a countertrend 381.% Fibonacci retracement, which broke down in 2019 and now appears to be resuming the downward trajectory of the primary trend. This trend suggest further gold outperformance even if the nominal price of each rises in tandem with a weakening dollar.
The same chart with only the 50 week moving average and 200-week moving average shows only three crosses over the past 20 years. These crosses are infrequent, and the 50 week MA falling through the 200-week MA in March would seem to confirm the expectation of further downside pressure in this ratio.
As always, I would love to know your feedback.

October 08, 2020
Gold and silver have played an important role throughout money's history. Unlike modern currencies, precious metals can't be created out of thin air and derive value from their scarcity.
