News
June 10, 2021
CANYON, Texas, June 8, 2021 /PRNewswire/ -- GoldStar Trust Company, one of America's largest custodians of self-directed IRAs specializing in precious metals, announces the addition of Texas Precious Metals Depository ("TPMD") as a secure storage location for customers. In conjunction with GoldStar's custodial services, TPMD will complement the retail services provided by Texas Precious Metals to provide turnkey solutions for precious metals IRA investors.
Per the Internal Revenue Code, retirement investors may incorporate physical bullion and coins meeting specific criteria into their portfolios while retaining the applicable tax benefits of their accounts. Any precious metals held in such accounts must be stored in a depository or other qualified third-party storage facility.
"We are excited to meet the growing needs of GoldStar Trust's precious metal investors by providing them with a secure storage option right here in Texas," said Jeff Kelley, president of GoldStar Trust Company. "Tarek and his team have been great partners for many years, and Texas Precious Metals was the clear choice."
"Having worked with GoldStar Trust for more than a decade, we believe them to be the premier IRA custodian in the United States. We are thrilled for the opportunity to expand our partnership and provide a Texas-based storage option for GoldStar clients," said Tarek Saab, President of Texas Precious Metals and TPMD.
Texas Precious Metals Depository is a private underground bullion depository. The facility is entombed in concrete with multiple layers of protection, bulletproof doors, biometric access, armed security and 24/7/365 interior and exterior surveillance. TPMD is insured by underwriters at Lloyd's of London and monitored by county and city law enforcement.
About GoldStar Trust Company GoldStar Trust began serving customers in 1989 and is the leader in providing specialized services as a self-directed IRA custodian, trustee and escrow/paying agent. With over $2.5 billion in assets, GoldStar Trust is custodian for more than 37,000 self-directed IRAs and offers unique retirement solutions that allow investors across the nation to diversify their IRA portfolios with alternative investments to traditional stocks, bonds and mutual funds. GoldStar Trust is the trust branch of Happy State Bank.
About Texas Precious Metals Depository TPMD has been used as the main storage and logistics center for Texas Precious Metals since 2012, processing nearly $1 billion in precious metals transactions during that time while servicing private, commercial and institutional clients. Texas Precious Metals and TPMD are subsidiaries of Kaspar Companies, a fifth-generation Texas business founded in 1898.
SOURCE GoldStar Trust Company

May 19, 2021
GOLD
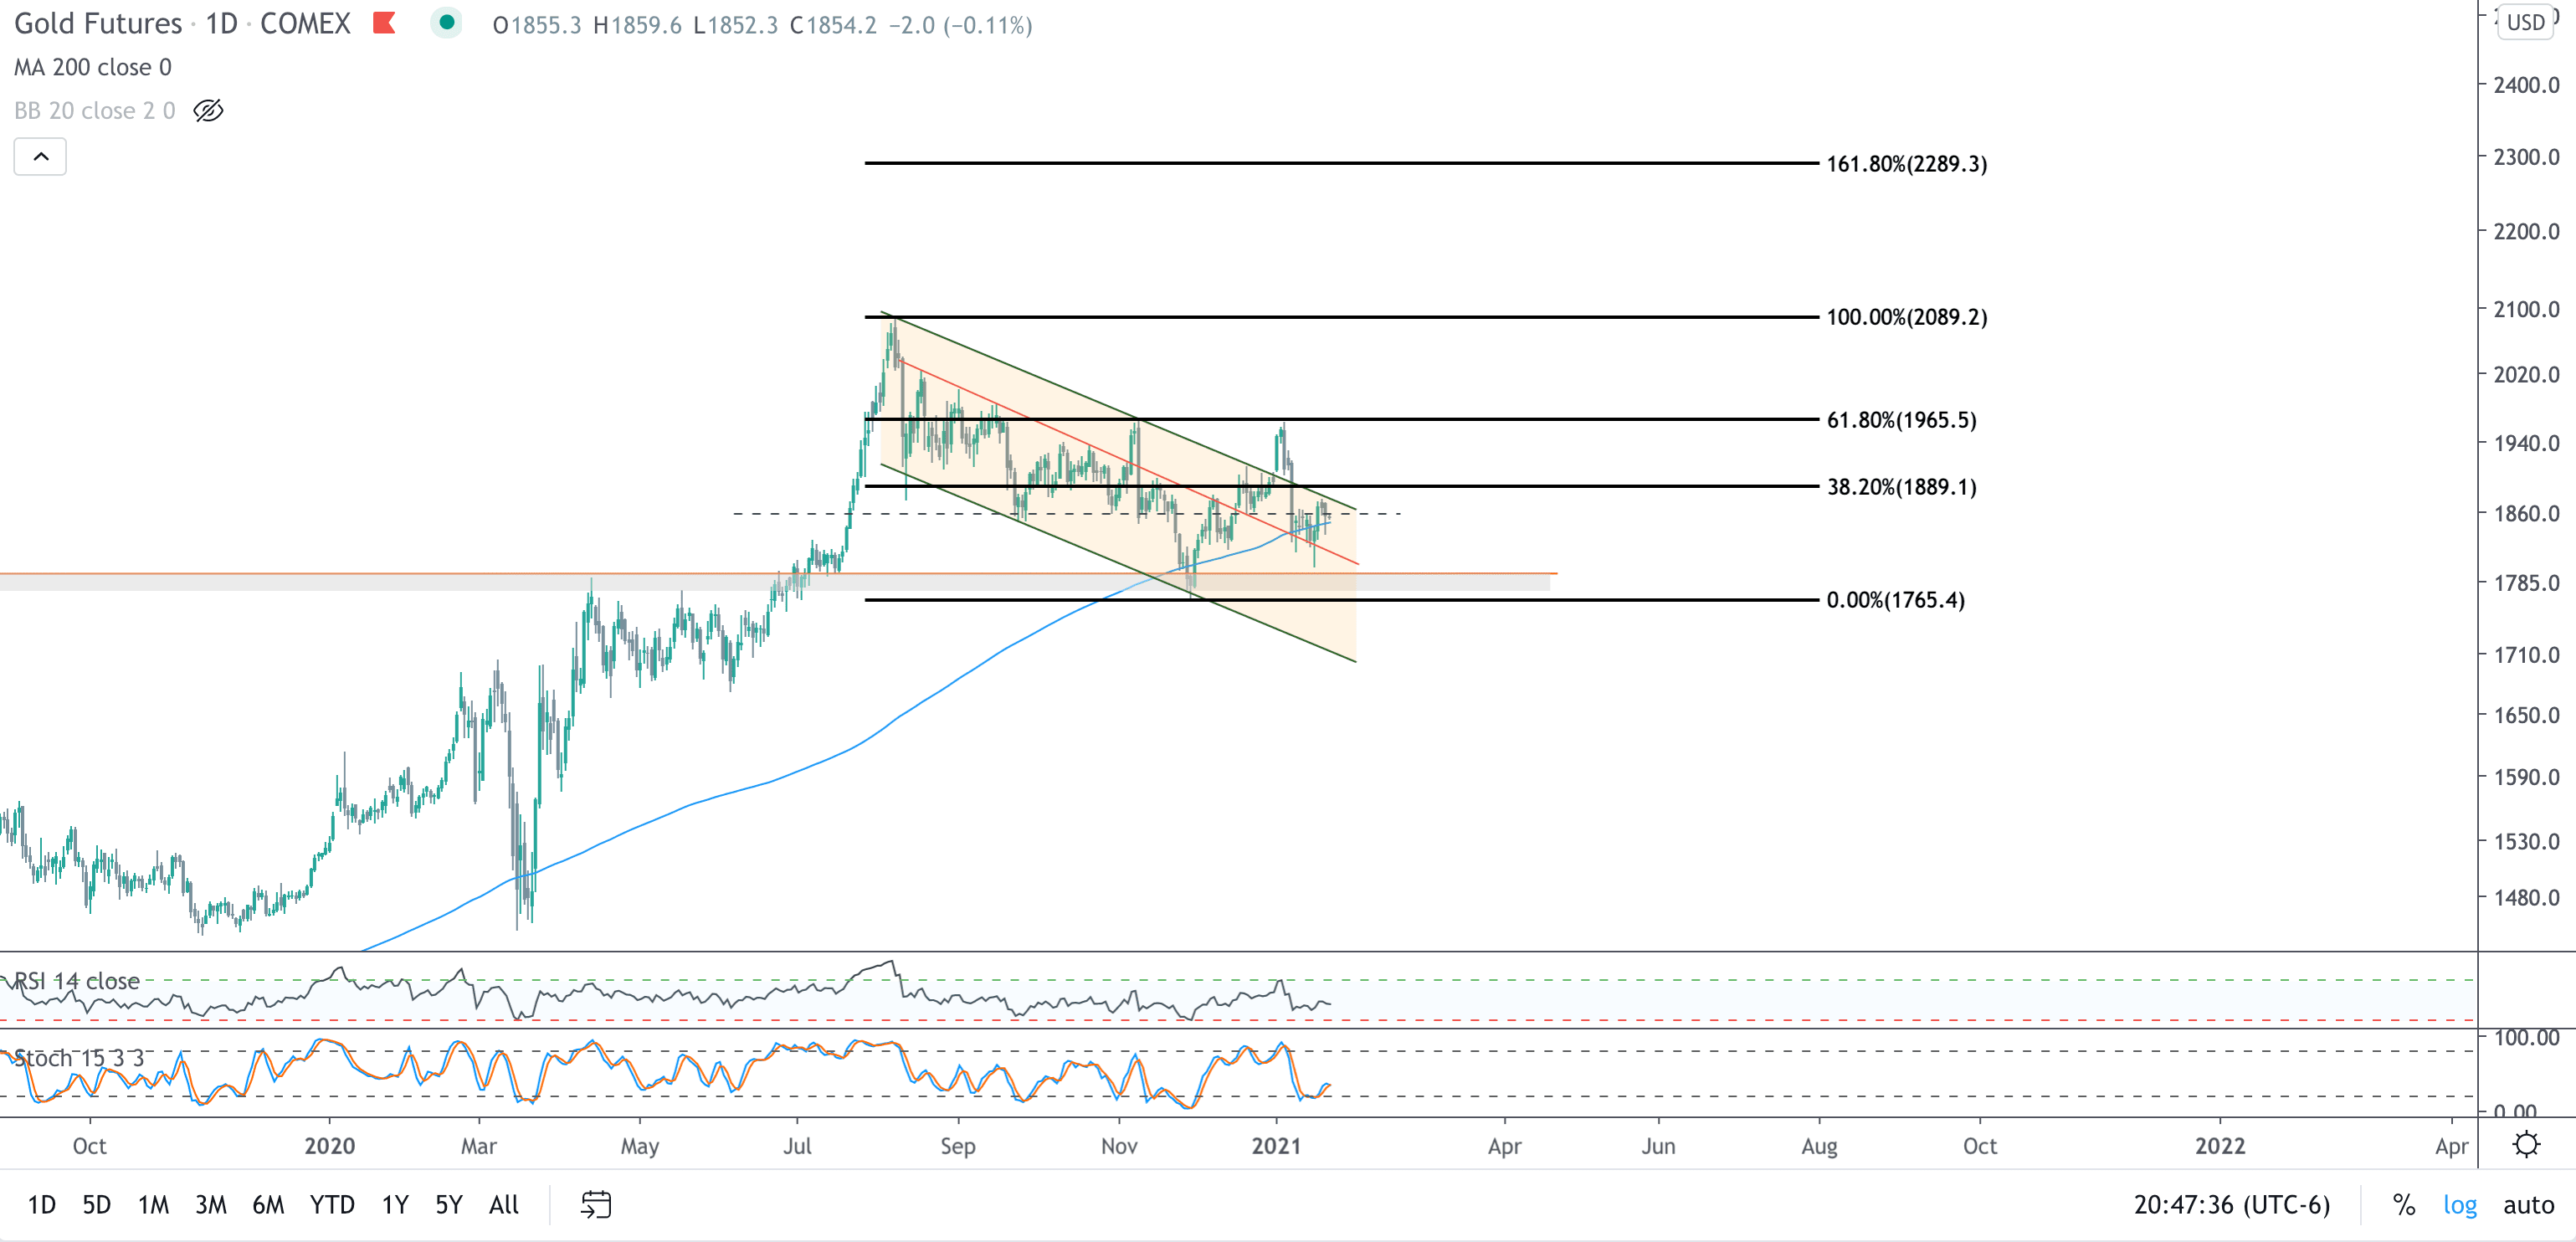
It has been awhile since I posted an update on metals, largely because metals have been stuck in quiet consolidation mode until the past week or so. We have been watching falling trend channel resistance on gold for the past six months, and after the double bottom in March around the 61.8% Fibonacci retracement, gold has steadily climbed, recapturing the 200 day moving average for the first time since February 2nd and breaking out above falling resistance of the multi-month bull flag that commenced with the August ’20 peak. Price action looks exceedingly constructive here, with RSI now in overbought territory for the first time in nine months. Bulls want to see price hold the 200 DMA, or at least stay above 1840. There is blue sky to 1965 if it does.
SILVER
Gold has been the laggard. Higher beta silver, as well as mining stocks, have led the way. Silver broke the 200 DMA in early April, and has once again hurdled the troublesome 25-27 area. Bulls need silver to hold 28.50 for a retest of 30, which it struck twice in the last nine months. A break of 30 should precipitate a swift move to the 161.8 Fibonacci extension at 35, which coincides with the October 2012 peak.
GOLD MINERS
GDX, the Gold Miner ETF, broker falling resistance on the 4th test back on April 15th, successfully retested, and has pushed its way back to the 61.8 Fibonacci retracement from the August high. Constructively, price has never fallen into oversold territory from the entire move following the March 2020 low – even during this long consolidation period. We are likely to see some digestion of price at these levels, but a break of 40 should ignite a move to retest the August 2020 high at 45.85.

March 04, 2021
GOLD
For the past month gold has been trading in a range between 1720 and 1780, struggling to make the breakout leap it seemed to promise the first week of the year. Gnawing at bulls is the fact that every other commodity, like copper, gold, zinc, and others, have exploded higher while gold seems stuck on the launch pad.
It seems to me that gold is leading, not lagging the other commodities. Gold's move in 2020 preceded, and even foreshadowed, the run in base metals and other commodities. Since then, the market has digested those gains while rotating capital into other assets.
This is depicted in the chart via a multi-month bull flag, which is a depiction of sellers taking gains against waning appetite on the demand side. This is healthy, and gold, thus far, remains in an uptrend.
The chart below now has gold coming into multiple support areas: rising trend support from the March 2020 low, falling channel support from the 2020 high, the 61.8% Fib retracement from March trough to September peak, and horizontal support.
Furthermore, sentiment is now at its worst since late 2015 as investors find returns in nearly every other asset class. The situation seems ripe for a rally, and at the very least, risk/reward seems to favor the bulls.
GDXJ - the gold junior mining ETF - is similarly coming into channel support and horizontal support, and price has not been oversold throughout the entire consolidation period. If gold and the gold miners are to rally, this is the area to do so.

January 25, 2021
GOLD
Metals bulls have been frustrated with repeated attempts to break out of a multi-month bull flag/falling channel. At the turn of the new year, with the presidential election all but behind the country, and with calls for more money-printing and ongoing stimulus, it seemed a given that – like the base metals and energy - gold would break out and follow the inflation narrative to higher prices. And, for three days, that is just what happened, as gold pushed from a 2020 close of $1895 to $1960 in the first three days of the new year, only to sell off hard and fall back below falling trend line support. This was gold’s second pass at $1960, which was the 6.18% Fibonacci retracement from the August high to the November low. As the saying goes, from failed moves come fast moves, and the failed move precipitated a $160 sell-off in a week and a half ($140 of which occurred in the 3 days following the peak). It was a major head fake for bulls and stopped out many traders who bought the breakout. Price also lost the 200-day moving average, which was another warning sign for bulls.
On the positive side, price recently recovered the 200-day moving average, stochastics have turned up, and despite the rapid selloff earlier in the month, the daily RSI never hit oversold conditions. Instead price has been stuck in no man’s land between 1800-1900 per ounce. The next real move can’t begin until gold recovers $1890 to break falling resistance and hurdle the 38.2% Fib retracement.
SILVER & PLATINUM
While gold has struggled, silver and platinum have remained surprisingly resilient. The higher beta cousins of the yellow metal tend to trend with gold, but more dramatically in percentage terms. It would seems both are being supported by the run-up in base metals, as each have industrial properties that are far broader than gold. In fact, on several occasions this month silver and platinum have traded up on days when gold has traded down. Silver remains stuck at long term support between $25-$26, nearly broke rising trend support with intraday dips into the $24 range, only to close above support. It’s now decision time as price is pinching between horizontal resistance and rising support. A key pivot point is $26.07, and a secular breakout occurs above $28.11.
For platinum, $1200 is the key level to watch. As platinum approaches $1200, I would expect to see some consolidation or a pullback as it builds the necessary power to break through long term resistance. This has been the key level since 2014. A break above $1200 opens up a move to $1300, above which would be extremely bullish.
DOLLAR
The recent dollar rebound has been the major headwind for the metals. As I stated in a previous post, the trend remains down and all signs point to further weakness. One final thrust towards 91 seems plausible, but ultimately price seems destined for 88.
S&P 500
The inflation narrative and weakness in bonds have supported higher equity prices. The Nasdaq in particular is an unstoppable train. Equity markets across the globe have been breaking out, and risk appetite is growing. Whatever you may think about valuations and the weakness of underlying economic conditions, all signs point toward higher equity prices ahead. For the S&P 500, 4000 is an important psychological level, with my near term target pushing to 4150.

December 21, 2020
The month of November was a bit of a roller coaster for metals bulls, as price appeared to breakout, only to reverse on vaccine news and become extremely oversold by mid-December. All the more frustrating was the continued sell-off in the US dollar, which many expected to spark the next leg higher in metals prices, but new lows in the dollar coincided with multi-month bottoms in metals. Meanwhile, all attention has since returned to bitcoin, which broke out to all-time highs while metals remained in consolidation mode. So, where are we now?
The thesis that I outlined in my post on October 14th remains the same: Metals up, Equities Up, Dollar down. The expectation then, as now, is for the 2021 reflation/inflation trade. To be clear, this expectation is not based on any personal macro-opinion; it is based on how I see price reacting to this general market consensus. The market can be wrong, and if it is, and inflation expectations are overblown, the price will warn us.
Let’s start with the hot topic du jour: Bitcoin.
BITCOIN
Bitcoin finally eclipsed its 2017 euphoric high last week and screamed to just north of $24,000/coin, which represents the 127.2 Fib Extension measured from the 2017 high to the March 2020 low. Fundamentals aside (are there any?) price looks poised to test $30,000 (the 161.8 Fib extension) on the next thrust. By any technical measure, bitcoin is in a major secular bull market, and the heights it may reach will likely shock many.
SILVER
Silver broke out in a big way in overnight trading with a massive $1.40 move late Sunday, December 20th. After finally breaking through falling resistance of its bull wedge in early December, silver eclipsed the all-important $26 level, which has served as either support or resistance no less than 11 times since 2011, and most recently following the September blow off high. This breakthrough now sets up an initial retest of $30/ounce, with $37 beyond there.
GOLD
Gold has quietly rallied $140 since the big sell-off in late November, and it is now knocking on falling resistance of its multi-month bull flag. As of this writing, price is on the cusp of a breakout at $1910, which sets up a quick retest of $1940 and $1960, above which should push price back north of $2100.
GSR
The Gold:Silver Ratio also continues to trend lower, which is an encouraging sign for bulls, as it implies stronger risk appetite in the space.
US DOLLAR
For the US Dollar, there is not much to add here. The trend is down, and 88 is a very key level, where we should expect to see some near term support. If price doesn't hold there, the US dollar will likely fall into the 70s on the index.