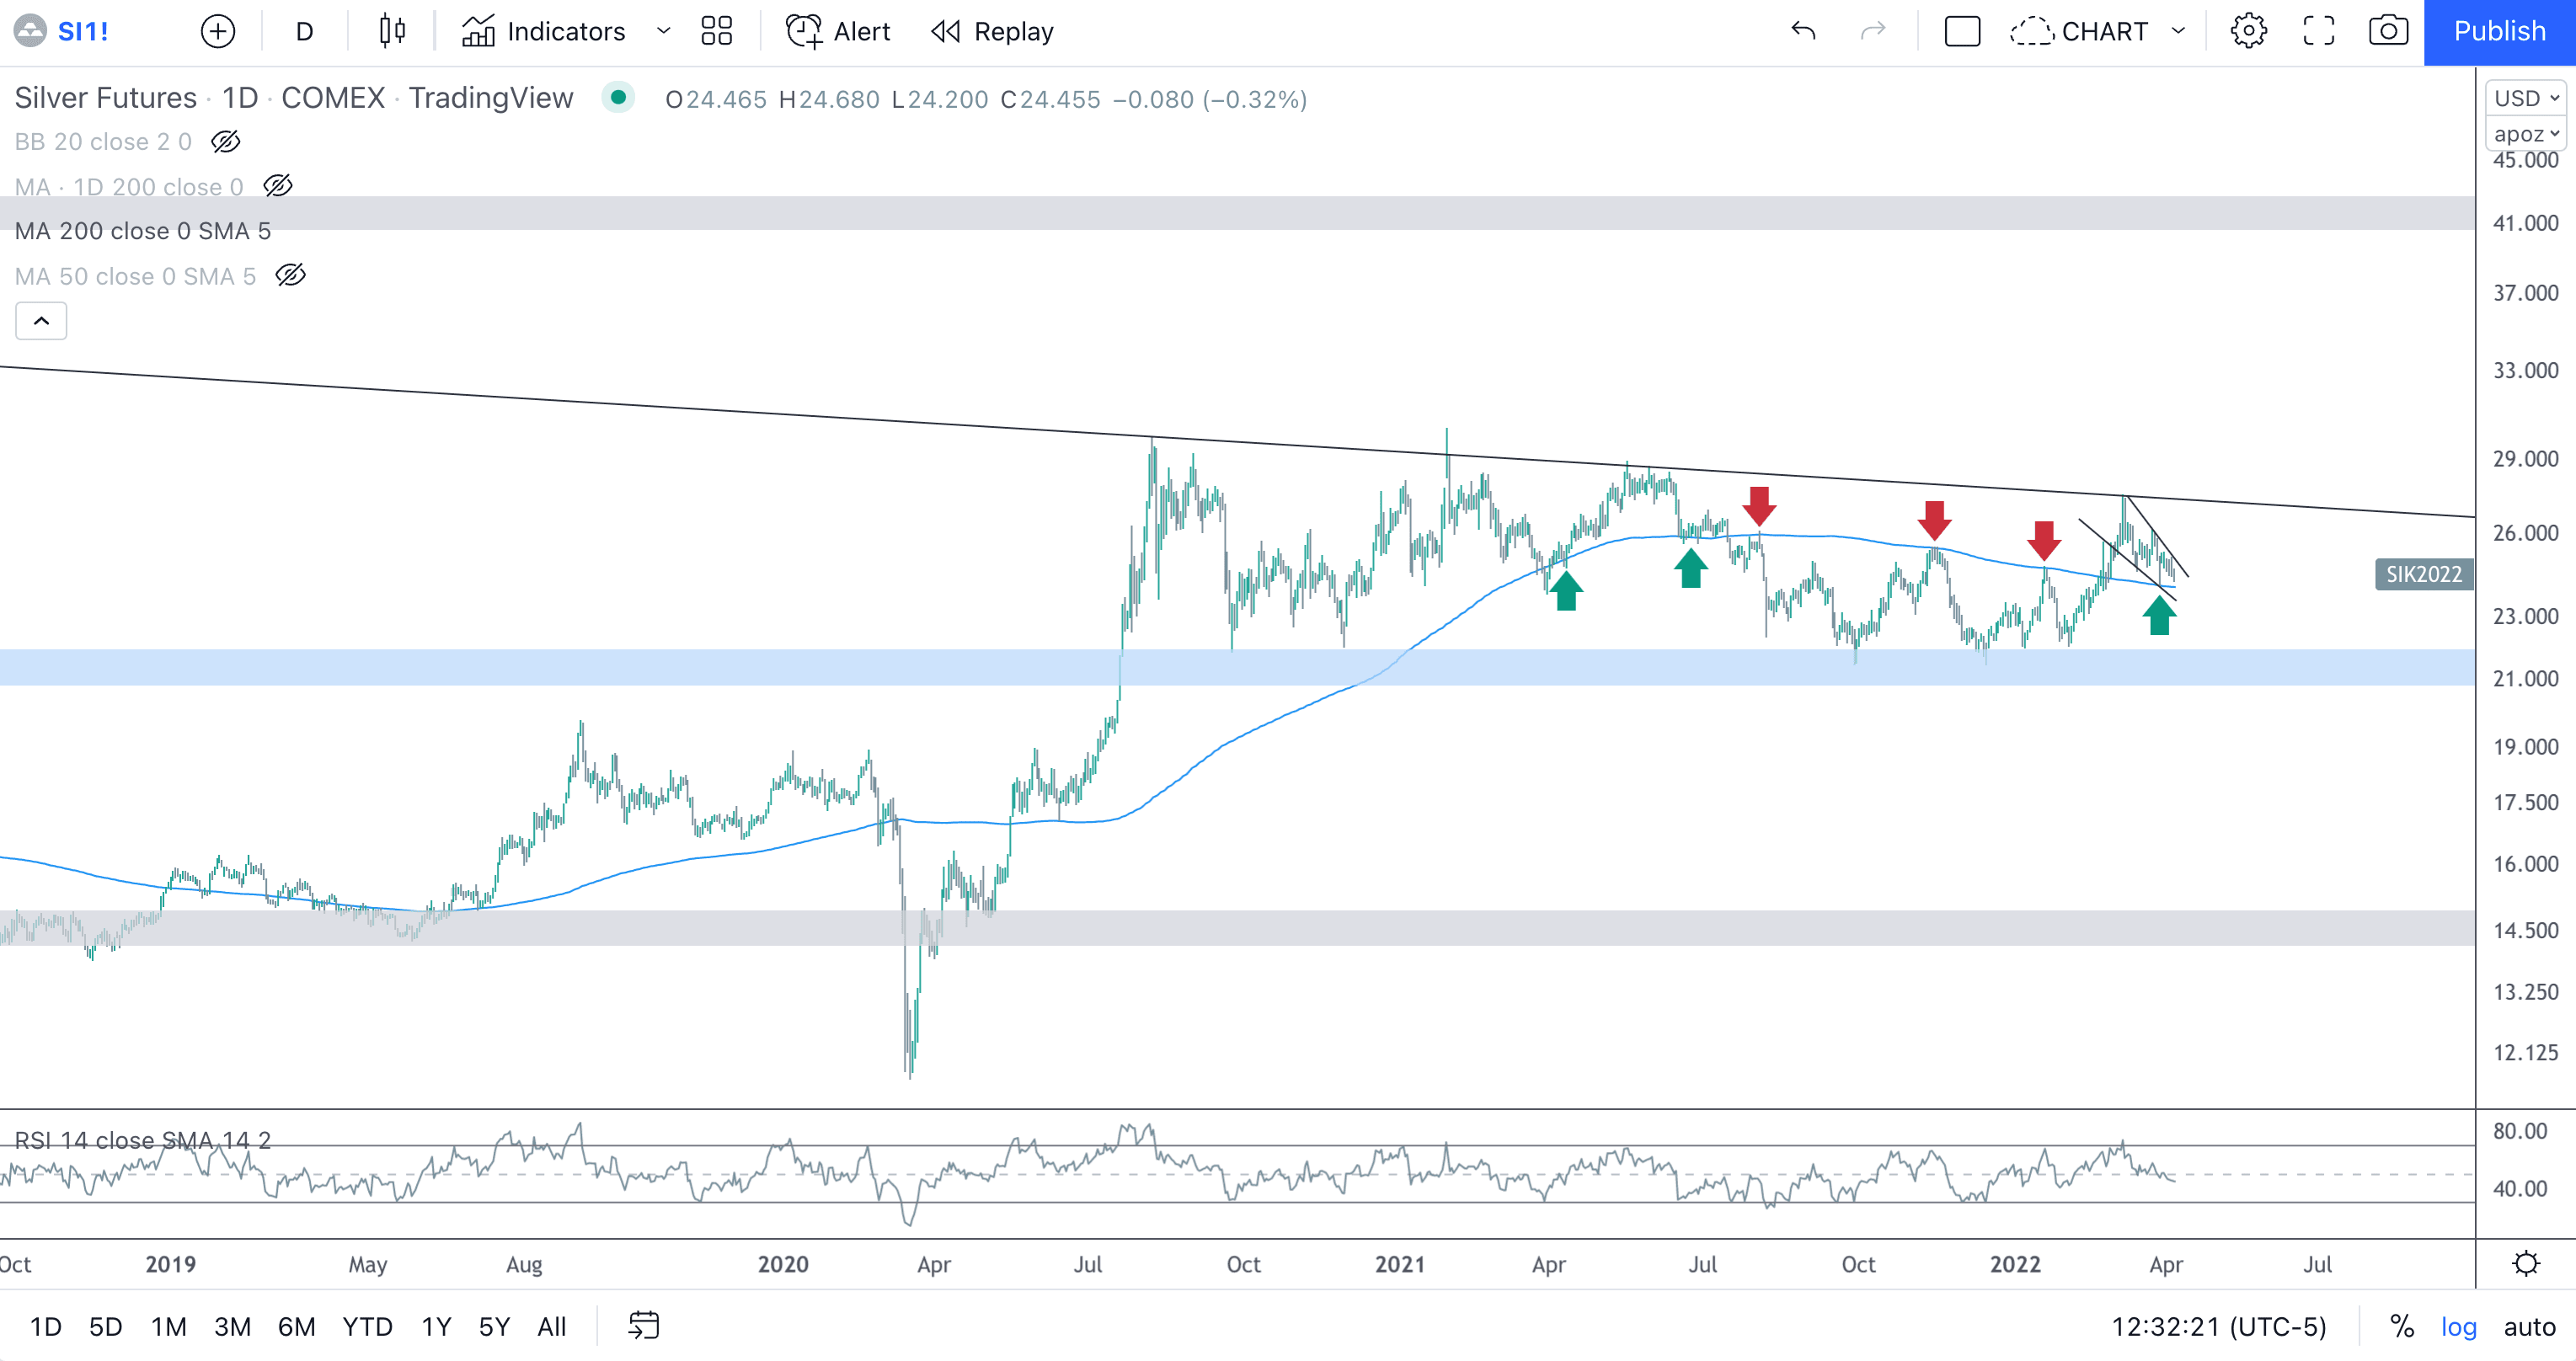
Silver Bouncing Around 200 DMA

Silver remains a slow moving, frustrating long position for metals bulls who have remained steadfast over the past two years while watching base metals, energy, ags, and virtually all other commodities explode in price over the past 18 months. Since the price peak in August of 2020, Silver is down almost 20% while the DBC commodity tracking ETF is up 170%. Let’s take a look at the tape. Silver has been flirting will long term support at 21.80 (tested 6 times since the breakout in 2020), and falling resistance from the 2011 high (which it has also tested six times). Within this long, two year price consolidation between long term support and long term resistance, action can be further broken down into response and activity around the 200 day moving average, where price found support in the spring and summer of 2021, broke in July and retested (and rejected) three times throughout the winter until finally breaking through in February. Last week’s sell-off pushed price right to the 200 DMA, where it found support and bounced hard.
Price is now forming a bull wedge, and a breakout of the wedge would likely precipitate a run to falling resistance in the $27 zone. With RSI sitting in the 40s, there is some potential energy in the system for a near term move.
Zooming out, silver looks good structurally. Price consolidation at long term support at 21.80 is clearly visible and forming a two-year ascending triangle. Big picture, the measured move on a breakout above $30 would create a price target right at $49 (at or around prior all-time highs). I view $30 as a key level, because it was the prior high in January 2021. A clean break above that level becomes very bullish.
Conversely, a breakdown below support at 21.80 would be bearish and likely precipitate a price waterfall back into the low teens.
